Visualizing metadata change in networks and / or clusters
Résumé
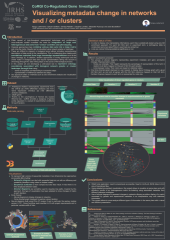
Visualizing metadata change in networks and / or clusters BIDefI Different visualizations produced: • Two groups of alluvial diagrams representing experiment metadata and gene annotation changes. Representation using: ○ Nodes as rectangle. Their height represents the percentage of representation of this term in relation to all items mapped on this part of GO for each iteration. ○ Links between nodes. Their colors are based on statistical status. • One force directed graph deployed on user request, to display Gene Ontology graph with a given GO Slim term as root and all genes with this GO Slim reference mapped on their GO term. Number of genes mapped on each term is represented by node size. Results Visualizations • To represent high volume of sequential metadata in two dimensions few approaches are possible [6] including: ○ Networks diagram can deal with sequential data but not with an efficiency and readability (iterations using colors or shapes codes). ○ Sequence sunburst is more compact but also less visual. In fact there is no links displayed between nodes. ○ Alluvial diagrams are sometime used to visualize tree paths. Inspired by this approach, this type of visualization has been adopted to show changes of matrix at each iteration. • Final choices: ○ Alluvial diagrams to display changes in networks. ○ Force directed graph deployed to explore a given iteration • Alluvial diagrams built using D3.js [7] version 5 and in particular the sankey module version 0.12.1. Some functions were rewritten to fit with project requirements and in particular variable width of links. Methods • Client side application, need to precompute as possible. Need to minify all JSON datas to limit size of transferred files. • Using adapted pre-existent visualizations, this project allows to visualize at same place and with efficiency, results of an heterogeneous matrix bi-clustering using associated metadata from different reference ontologies. • Use of alluvial diagrams to represent changes in networks allowing evolution display of a matrix composed by genetic and experimental metadata in an interpretative way with statistical information. • This project allows to cross-analyze different types of information in the same place with a visual and efficient presentation. Conclusions [1] Ashburner M, Ball CA, Blake JA, et al. Gene ontology: tool for the unification of biology.
Fichier principal
 DIVIS_poster_JOBIM_2019_CoRGi.pdf (1.43 Mo)
Télécharger le fichier
DIVIS_JOBIM2019.pdf (52.78 Ko)
Télécharger le fichier
DIVIS_poster_JOBIM_2019_CoRGi.pdf (1.43 Mo)
Télécharger le fichier
DIVIS_JOBIM2019.pdf (52.78 Ko)
Télécharger le fichier
Origine : Fichiers produits par l'(les) auteur(s)
Origine : Fichiers produits par l'(les) auteur(s)
Loading...