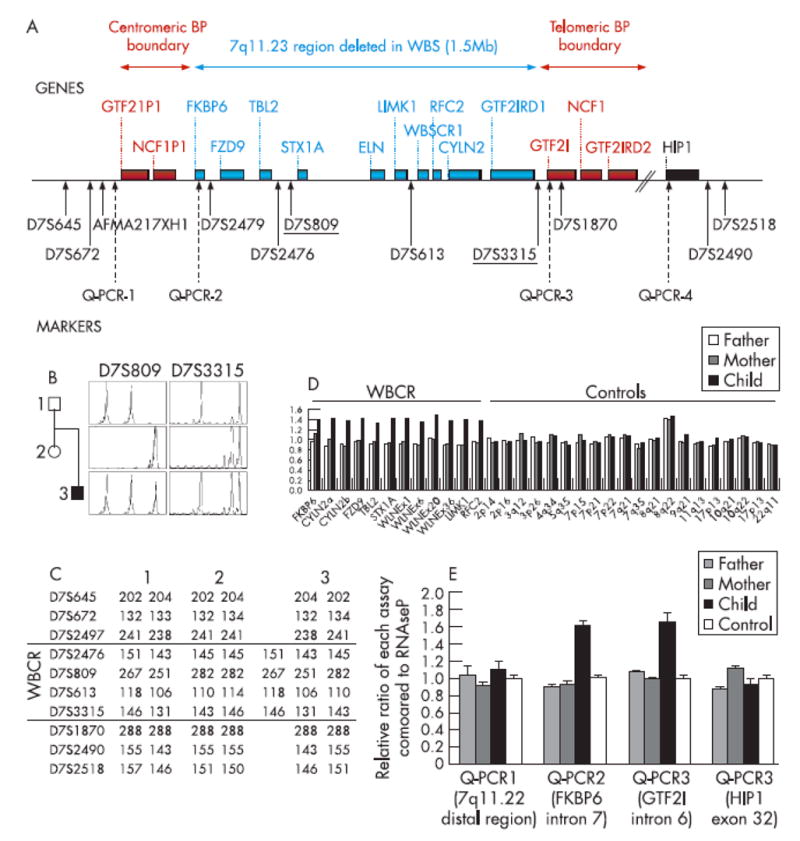
Figure 1.
Molecular analysis of the proband. A) Schematic representation of the WBCR and location of the markers used in this study. Genes are shown above and markers are indicated below with arrows. Solid arrows indicate microsatellite markers and dotted arrows indicate the real-time PCR assays (Q-PCR-1 to 4). The markers used for quantitative microsatellite analysis are underlined. B) Pedigree and electropherograms for microsatellite markers D73315 and D7S809 showing three different alleles which are indicative of a 7qll duplication in the proband. C) Haplotype analysis of the family showing the paternal origin of the 7q11 duplication. Five microsatellite markers inside the minimal critical region (D7S2479, D7S2476, D7S809, D7S613, D7S3315) and two microsatellite markers outside the region (D7S672, D7S645) were genotyped at the 7q11 locus for the three family members. D) Fine analysis of the duplication detected in the proband by MLPA (7q11.23/ELN), showing a duplication of the FKBP6, FZD9, TBL2, STX1A, ELN, LIMK1, RFC2 and CYLN2 genes. The relative ratios indicate the relative area of the peak in the patient compared to that of a control. E) Delineation of the duplication. Four real-time PCR assays were used to quantify the allele copy number at the boundaries of the 7q11 minimal region.