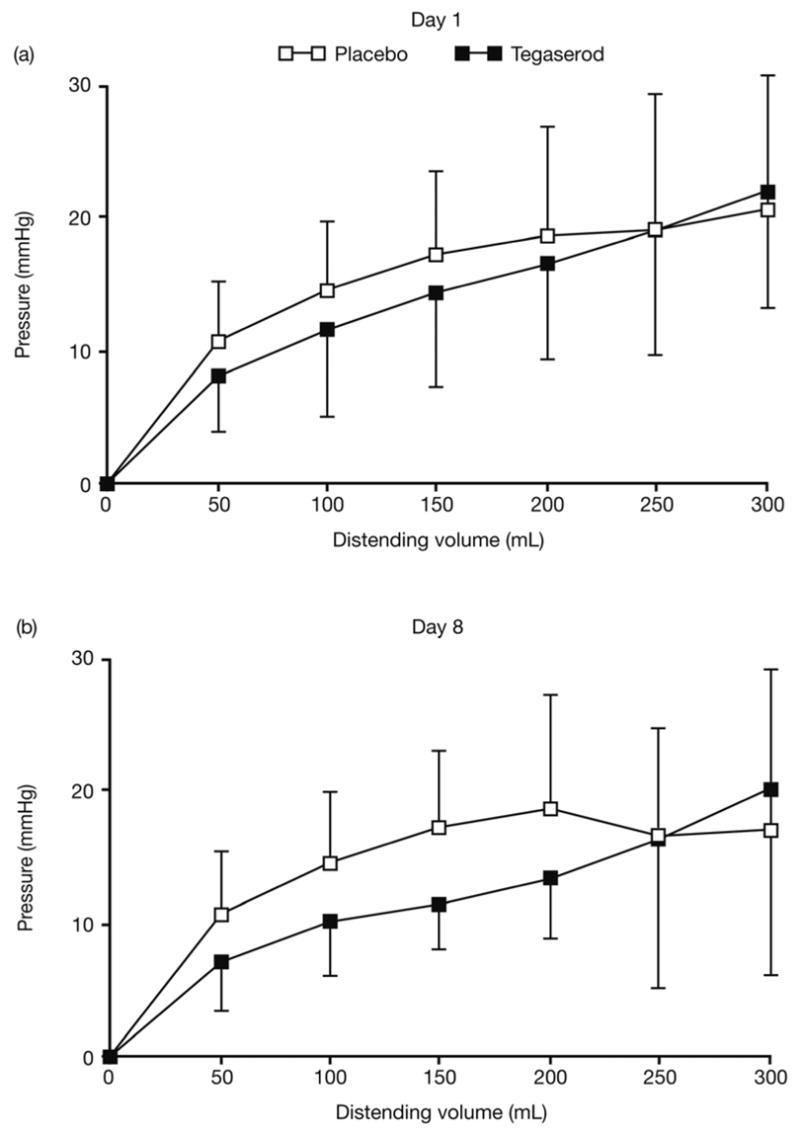
Figure 4. Pressure–volume relationships before (a) and after (b) 1 week of treatment with placebo (white) or tegaserod (black)
The pressure–volume curves were not significantly altered by treatment.
Figure 4. Pressure–volume relationships before (a) and after (b) 1 week of treatment with placebo (white) or tegaserod (black)
The pressure–volume curves were not significantly altered by treatment.