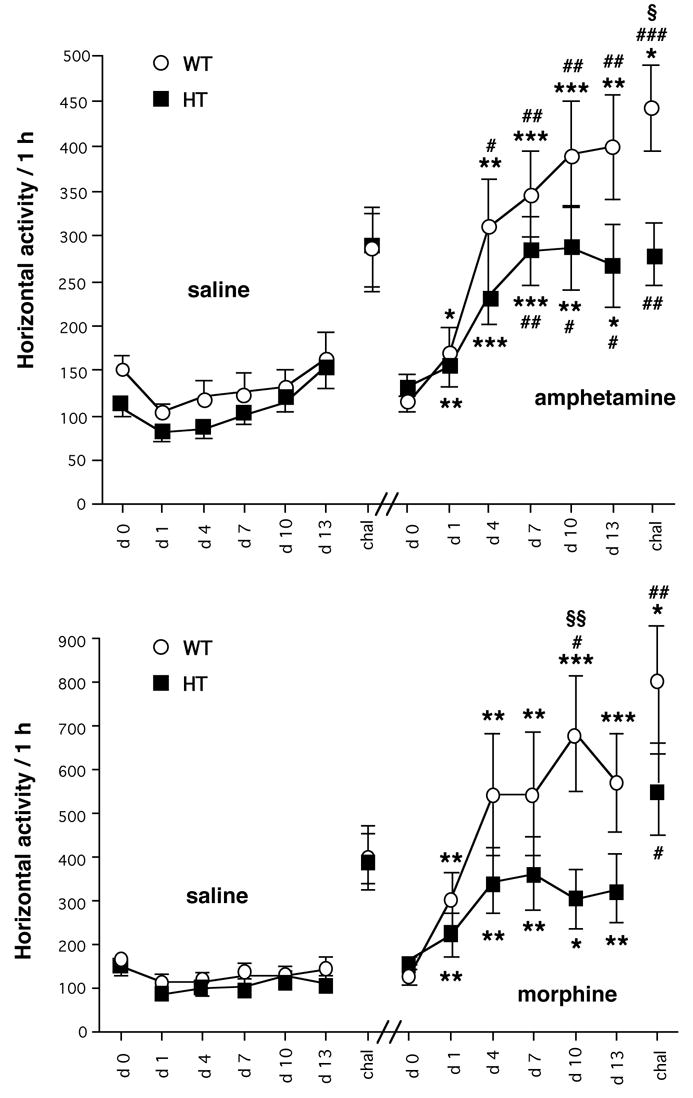
Figure 2.
Effects of repeated administration of d-amphetamine and morphine in CN98 WT and mutant mice. Values represent mean ± SEM (n = 12–14). *P < 0.05, **P < 0.01, ***P < 0.001 vs. saline-treated mice of the same genotype at the same time point; #P < 0.05, ##P < 0.01, ###P < 0.001 vs. the first pairing day within the same treatment group; § P < 0.05, §§P < 0.01, WT vs. mutant mice at the same time point (ANOVA followed by Fisher’s test).